Watch These Intel Price Levels as Stock Surges After CEO Provides Business Update

Shares Surged Nearly 8% in Extended Trading on Monday

Key Takeaways
Intel shares surged nearly 8% in extended trading on Monday, adding to big gains during regular trading, after the embattled chipmaker’s CEO Pat Gelsinger provided an update on the company’s plans to slash costs and turn around its business.
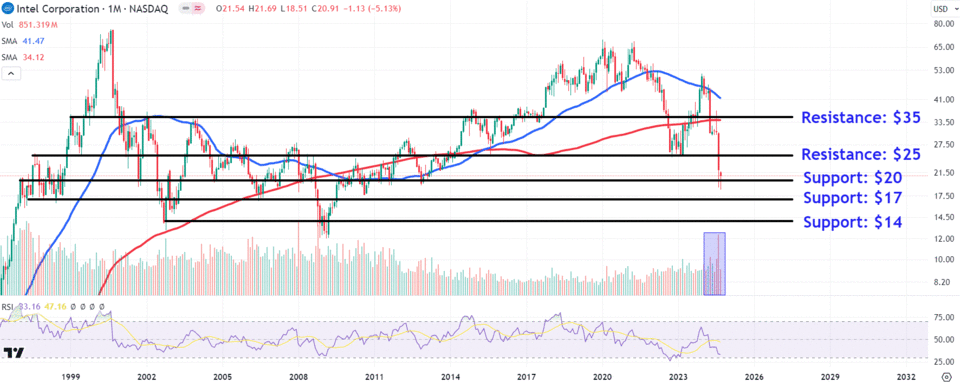
Although the shares hit a new multi-year low this month, they have made a partial recovery to currently trade near their September high, potentially forming a hammer, a candlestick pattern that suggests a bullish reversal.
Investors should monitor important support levels on Intel’s monthly chart at $20, $17, and $14, while watching key resistance areas at $25 and $35.
Intel (INTC) shares surged in extended trading on Monday after the embattled chipmaker’s CEO Pat Gelsinger provided an update on the company’s plans to slash costs and turn around its business.
Gelsinger said in a note to employees released after the closing bell that Intel has made progress in lowering costs through layoffs, trimming its real estate footprint, and selling part of its stake in its Altera programmable chip unit, among other steps. The company also plans to turn its chipmaking arm into a separate subsidiary and said it would produce chips for Amazon (AMZN), as well as the U.S. military.
Intel shares rose 7.9% in after-hours trading to $22.56. The stock had risen more than 6% during regular trading hours following a report from Bloomberg on the contract to produce custom chips for the military. Even with Monday’s gains, the stock has shed more than half its value since the start of the year.
Below, we’ll take a closer look at Intel’s monthly chart and use technical analysis to identify key historical price levels worth watching.
Potential Hammer Candlestick Forming
After encountering significant selling pressure at the closely watched 50-day moving average (MA) in December last year, Intel shares have trended sharply lower, falling as much as 64% since that time. Importantly, trading volumes have increased during the stock’s sell-off, indicating conviction behind the move.
Although the shares hit a new multi-year low this month, they have made a partial recovery to currently trade near their September high, potentially forming a hammer—a candlestick pattern that suggests a bullish reversal.
Looking ahead, investors should monitor several key price levels on Intel’s chart that will likely gain close attention.
Important Support Levels to Watch
Firstly, it’s worth keeping a close eye on the $20 area, a price level the stock reclaimed on Monday. This location on the chart finds a confluence of support from the psychological round number and a horizontal line that connects a range of historical trading levels in the chipmaker’s stock from 1997 to 2012. Confirmation of a September hammer pattern at this key level would register a significant win for the bulls.
However, a continuation of Intel’s downtrend could see the shares fall to around $17, where they would likely find support from a period of consolidation in the stock between 1997 and 1998, an area that also closely aligns with troughs in 2006 and 2010.
Longer-term weakness may bring the $14 region into play, an area on the chart where buy-and-hold investors would likely seek entry points near prominent swing lows that formed during the dotcom bubble correction of 2002 and great recession in 2009.
Key Overhead Levels to Monitor
If an upside reversal takes place in Intel shares, investors should initially keep an eye on the $25 level, a key overhead area where the stock could run into resistance from a horizontal line linking multiple peaks and troughs between 1997 and February last year.
A move above this area could see the shares climb to $35, where they may encounter selling pressure near a trendline joining a series of price action from 1999 to October 2023 with the closely-aligned 200-day moving average.
The comments, opinions, and analyses expressed on Investopedia are for informational purposes only. Read our warranty and liability disclaimer for more info.
As of the date this article was written, the author does not own any of the above securities.
Read the original article on Investopedia.
Source link


